ملاحظة
Go to the end to download the full example code. or to run this example in your browser via JupyterLite or Binder
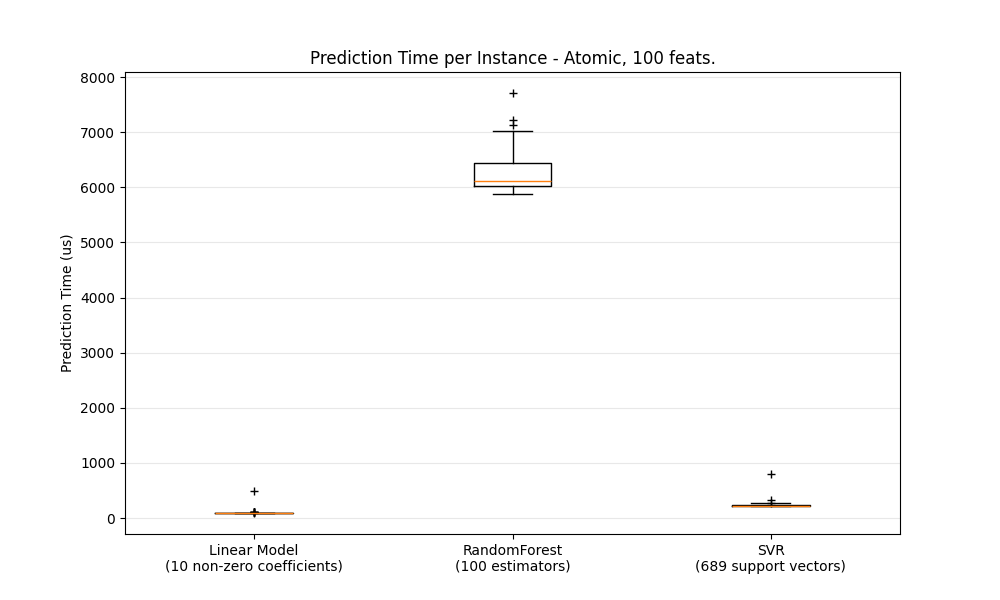
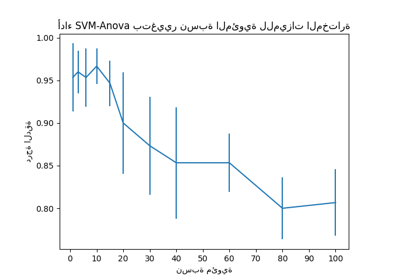
تأخير التنبؤ#
هذا مثال يوضح تأخير التنبؤ لمختلف الخوارزميات في مكتبة ساي كيت ليرن.
الهدف هو قياس التأخير المتوقع عند إجراء التنبؤات إما بالجملة أو بالطريقة الذرية (أي واحدًا تلو الآخر).
تمثل المخططات توزيع تأخير التنبؤ على شكل مخطط صندوقي.
# المؤلفون: مطوري ساي كيت ليرن
# معرف الترخيص: BSD-3-Clause

import gc
import time
from collections import defaultdict

import matplotlib.pyplot as plt
import numpy as np

from sklearn.datasets import make_regression
from sklearn.ensemble import RandomForestRegressor
from sklearn.linear_model import Ridge, SGDRegressor
from sklearn.model_selection import train_test_split
from sklearn.preprocessing import StandardScaler
from sklearn.svm import SVR
from sklearn.utils import shuffle


def _not_in_sphinx():
    # خدعة للكشف عما إذا كنا نعمل بواسطة باني سفينكس
    return "__file__" in globals()
وظائف مساعدة للقياس والرسم#
def atomic_benchmark_estimator(estimator, X_test, verbose=False):
"""قياس وقت تشغيل التنبؤ لكل مثيل."""
n_instances = X_test.shape[0]
runtimes = np.zeros(n_instances, dtype=float)
for i in range(n_instances):
instance = X_test[[i], :]
start = time.time()
estimator.predict(instance)
runtimes[i] = time.time() - start
if verbose:
print(
"atomic_benchmark runtimes:",
min(runtimes),
np.percentile(runtimes, 50),
max(runtimes),
)
return runtimes
def bulk_benchmark_estimator(estimator, X_test, n_bulk_repeats, verbose):
"""قياس وقت تشغيل التنبؤ للمدخلات بالكامل."""
n_instances = X_test.shape[0]
runtimes = np.zeros(n_bulk_repeats, dtype=float)
for i in range(n_bulk_repeats):
start = time.time()
estimator.predict(X_test)
runtimes[i] = time.time() - start
runtimes = np.array(list(map(lambda x: x / float(n_instances), runtimes)))
if verbose:
print(
"bulk_benchmark runtimes:",
min(runtimes),
np.percentile(runtimes, 50),
max(runtimes),
)
return runtimes
def benchmark_estimator(estimator, X_test, n_bulk_repeats=30, verbose=False):
"""
قياس أوقات التشغيل للتنبؤ في الوضع الذري والمجمع.
المعلمات
----------
estimator : خوارزمية مدربة بالفعل تدعم `predict()`
X_test : مدخلات الاختبار
n_bulk_repeats : عدد مرات التكرار عند تقييم الوضع المجمع
العائدات
-------
atomic_runtimes, bulk_runtimes : زوج من `np.array` الذي يحتوي على أوقات التشغيل بالثواني.
"""
atomic_runtimes = atomic_benchmark_estimator(estimator, X_test, verbose)
bulk_runtimes = bulk_benchmark_estimator(estimator, X_test, n_bulk_repeats, verbose)
return atomic_runtimes, bulk_runtimes
def generate_dataset(n_train, n_test, n_features, noise=0.1, verbose=False):
"""توليد مجموعة بيانات للانحدار بالمعايير المحددة."""
if verbose:
print("generating dataset...")
X, y, coef = make_regression(
n_samples=n_train + n_test, n_features=n_features, noise=noise, coef=True
)
random_seed = 13
X_train, X_test, y_train, y_test = train_test_split(
X, y, train_size=n_train, test_size=n_test, random_state=random_seed
)
X_train, y_train = shuffle(X_train, y_train, random_state=random_seed)
X_scaler = StandardScaler()
X_train = X_scaler.fit_transform(X_train)
X_test = X_scaler.transform(X_test)
y_scaler = StandardScaler()
y_train = y_scaler.fit_transform(y_train[:, None])[:, 0]
y_test = y_scaler.transform(y_test[:, None])[:, 0]
gc.collect()
if verbose:
print("ok")
return X_train, y_train, X_test, y_test
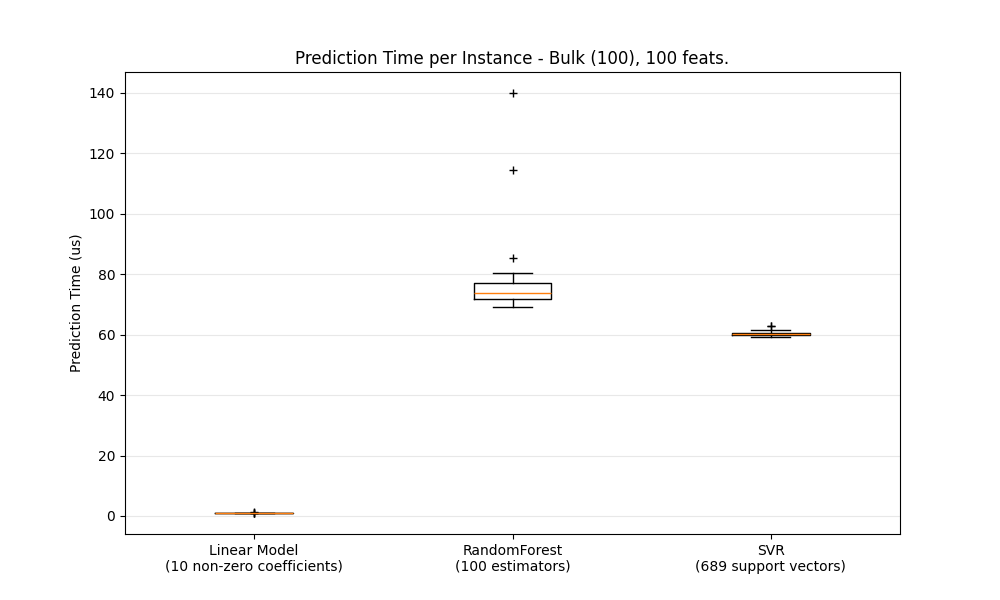
def boxplot_runtimes(runtimes, pred_type, configuration):
"""
رسم مخطط جديد مع مخططات صندوقية لأوقات التنبؤ.
المعلمات
----------
runtimes : قائمة من `np.array` من التأخيرات بالميكروثانية
cls_names : قائمة من أسماء الخوارزميات التي ولدت أوقات التنبؤ
pred_type : 'bulk' أو 'atomic'
"""
fig, ax1 = plt.subplots(figsize=(10, 6))
bp = plt.boxplot(
runtimes,
)
cls_infos = [
"%s\n(%d %s)"
% (
estimator_conf["name"],
estimator_conf["complexity_computer"](estimator_conf["instance"]),
estimator_conf["complexity_label"],
)
for estimator_conf in configuration["estimators"]
]
plt.setp(ax1, xticklabels=cls_infos)
plt.setp(bp["boxes"], color="black")
plt.setp(bp["whiskers"], color="black")
plt.setp(bp["fliers"], color="red", marker="+")
ax1.yaxis.grid(True, linestyle="-", which="major", color="lightgrey", alpha=0.5)
ax1.set_axisbelow(True)
ax1.set_title(
"Prediction Time per Instance - %s, %d feats."
% (pred_type.capitalize(), configuration["n_features"])
)
ax1.set_ylabel("Prediction Time (us)")
plt.show()
def benchmark(configuration):
"""تشغيل القياس بالكامل."""
X_train, y_train, X_test, y_test = generate_dataset(
configuration["n_train"], configuration["n_test"], configuration["n_features"]
)
stats = {}
for estimator_conf in configuration["estimators"]:
print("Benchmarking", estimator_conf["instance"])
estimator_conf["instance"].fit(X_train, y_train)
gc.collect()
a, b = benchmark_estimator(estimator_conf["instance"], X_test)
stats[estimator_conf["name"]] = {"atomic": a, "bulk": b}
cls_names = [
estimator_conf["name"] for estimator_conf in configuration["estimators"]
]
runtimes = [1e6 * stats[clf_name]["atomic"] for clf_name in cls_names]
boxplot_runtimes(runtimes, "atomic", configuration)
runtimes = [1e6 * stats[clf_name]["bulk"] for clf_name in cls_names]
boxplot_runtimes(runtimes, "bulk (%d)" % configuration["n_test"], configuration)
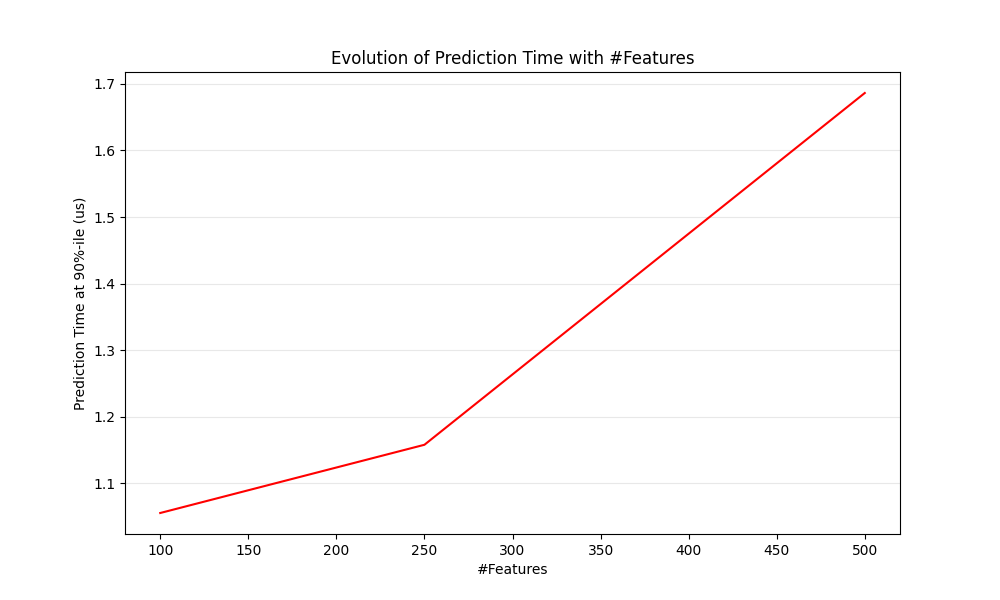
def n_feature_influence(estimators, n_train, n_test, n_features, percentile):
"""
تقدير تأثير عدد الميزات على وقت التنبؤ.
المعلمات
----------
estimators : قاموس من (الاسم (str)، الخوارزمية) للقياس
n_train : عدد مثيلات التدريب (int)
n_test : عدد مثيلات الاختبار (int)
n_features : قائمة بأبعاد المساحة المميزة للاختبار (int)
percentile : المئوية التي يتم عندها قياس السرعة (int [0-100])
العائدات:
--------
percentiles : dict(estimator_name,
dict(n_features, percentile_perf_in_us))
"""
percentiles = defaultdict(defaultdict)
for n in n_features:
print("benchmarking with %d features" % n)
X_train, y_train, X_test, y_test = generate_dataset(n_train, n_test, n)
for cls_name, estimator in estimators.items():
estimator.fit(X_train, y_train)
gc.collect()
runtimes = bulk_benchmark_estimator(estimator, X_test, 30, False)
percentiles[cls_name][n] = 1e6 * np.percentile(runtimes, percentile)
return percentiles
def plot_n_features_influence(percentiles, percentile):
fig, ax1 = plt.subplots(figsize=(10, 6))
colors = ["r", "g", "b"]
for i, cls_name in enumerate(percentiles.keys()):
x = np.array(sorted(percentiles[cls_name].keys()))
y = np.array([percentiles[cls_name][n] for n in x])
plt.plot(
x,
y,
color=colors[i],
)
ax1.yaxis.grid(True, linestyle="-", which="major", color="lightgrey", alpha=0.5)
ax1.set_axisbelow(True)
ax1.set_title("Evolution of Prediction Time with #Features")
ax1.set_xlabel("#Features")
ax1.set_ylabel("Prediction Time at %d%%-ile (us)" % percentile)
plt.show()
def benchmark_throughputs(configuration, duration_secs=0.1):
"""قياس الإنتاجية للخوارزميات المختلفة."""
X_train, y_train, X_test, y_test = generate_dataset(
configuration["n_train"], configuration["n_test"], configuration["n_features"]
)
throughputs = dict()
for estimator_config in configuration["estimators"]:
estimator_config["instance"].fit(X_train, y_train)
start_time = time.time()
n_predictions = 0
while (time.time() - start_time) < duration_secs:
estimator_config["instance"].predict(X_test[[0]])
n_predictions += 1
throughputs[estimator_config["name"]] = n_predictions / duration_secs
return throughputs
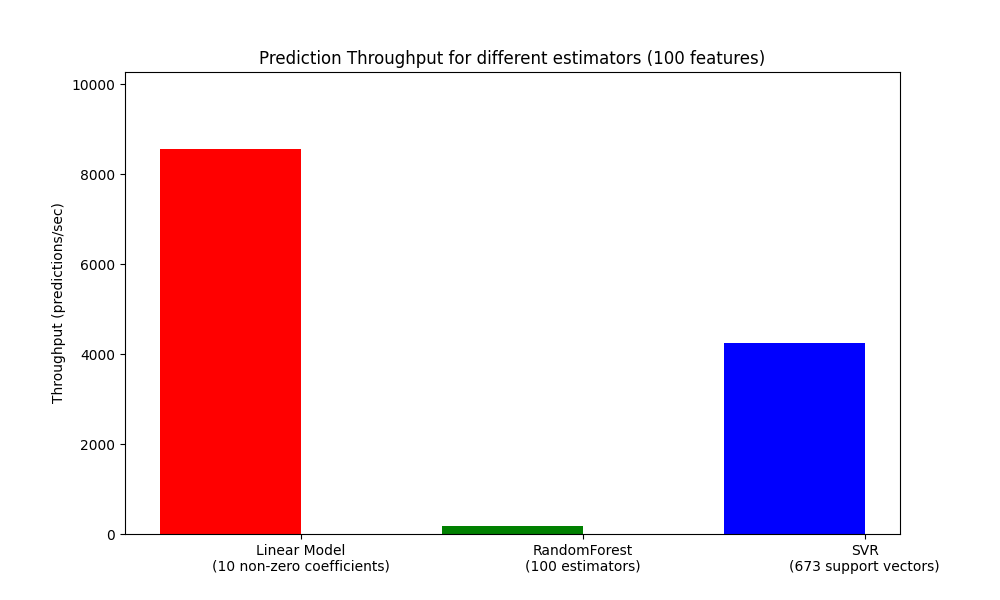
def plot_benchmark_throughput(throughputs, configuration):
fig, ax = plt.subplots(figsize=(10, 6))
colors = ["r", "g", "b"]
cls_infos = [
"%s\n(%d %s)"
% (
estimator_conf["name"],
estimator_conf["complexity_computer"](estimator_conf["instance"]),
estimator_conf["complexity_label"],
)
for estimator_conf in configuration["estimators"]
]
cls_values = [
throughputs[estimator_conf["name"]]
for estimator_conf in configuration["estimators"]
]
plt.bar(range(len(throughputs)), cls_values, width=0.5, color=colors)
ax.set_xticks(np.linspace(0.25, len(throughputs) - 0.75, len(throughputs)))
ax.set_xticklabels(cls_infos, fontsize=10)
ymax = max(cls_values) * 1.2
ax.set_ylim((0, ymax))
ax.set_ylabel("Throughput (predictions/sec)")
ax.set_title(
"Prediction Throughput for different estimators (%d features)"
% configuration["n_features"]
)
plt.show()
قياس سرعة التنبؤ بالجملة/الذرية لمختلف الخوارزميات#
configuration = {
    "n_train": int(1e3),
    "n_test": int(1e2),
    "n_features": int(1e2),
    "estimators": [
        {
            "name": "Linear Model",
            "instance": SGDRegressor(
                penalty="elasticnet", alpha=0.01, l1_ratio=0.25, tol=1e-4
            ),
            "complexity_label": "non-zero coefficients",
            "complexity_computer": lambda clf: np.count_nonzero(clf.coef_),
        },
        {
            "name": "RandomForest",
            "instance": RandomForestRegressor(),
            "complexity_label": "estimators",
            "complexity_computer": lambda clf: clf.n_estimators,
        },
        {
            "name": "SVR",
            "instance": SVR(kernel="rbf"),
            "complexity_label": "support vectors",
            "complexity_computer": lambda clf: len(clf.support_vectors_),
        },
    ],
}
benchmark(configuration)
Benchmarking SGDRegressor(alpha=0.01, l1_ratio=0.25, penalty='elasticnet', tol=0.0001)
Benchmarking RandomForestRegressor()
Benchmarking SVR()
قياس تأثير n_features على سرعة التنبؤ#
percentile = 90
percentiles = n_feature_influence(
    {"ridge": Ridge()},
    configuration["n_train"],
    configuration["n_test"],
    [100, 250, 500],
    percentile,
)
plot_n_features_influence(percentiles, percentile)
benchmarking with 100 features
benchmarking with 250 features
benchmarking with 500 features
قياس الإنتاجية#
throughputs = benchmark_throughputs(configuration)
plot_benchmark_throughput(throughputs, configuration)
Total running time of the script: (0 minutes 16.644 seconds)
Related examples
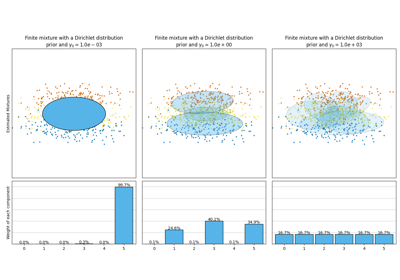
تحليل نوع أولوية التركيز لخوارزمية التباين بايزي غاوسي ميكسشر
تحليل نوع أولوية التركيز لخوارزمية التباين بايزي غاوسي ميكسشر
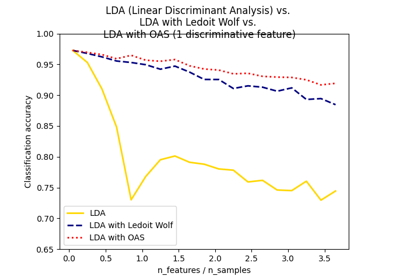
Normal, Ledoit-Wolf and OAS Linear Discriminant Analysis for classification
Normal, Ledoit-Wolf and OAS Linear Discriminant Analysis for classification