ملاحظة
Go to the end to download the full example code. or to run this example in your browser via JupyterLite or Binder
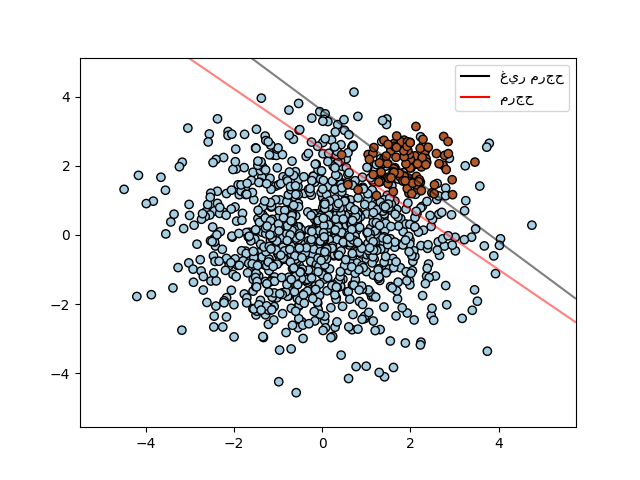
SVM: المستوي الفاصل للطبقات غير المتوازنة#
ابحث عن المستوي الفاصل الأمثل باستخدام SVC للطبقات غير المتوازنة.
نحن نجد أولاً المستوي الفاصل باستخدام SVC العادي، ثم نرسم (بخط متقطع) المستوي الفاصل مع تصحيح تلقائي للطبقات غير المتوازنة.
ملاحظة
يمكن أيضاً تنفيذ هذا المثال عن طريق استبدال SVC(kernel="linear")
بـ SGDClassifier(loss="hinge"). حيث أن تعيين معلمة "loss"
في SGDClassifier إلى "hinge" سيؤدي إلى سلوك مشابه
لتصنيف SVC مع نواة خطية.
على سبيل المثال، جرب بدلاً من SVC:
clf = SGDClassifier(n_iter=100, alpha=0.01)
# المؤلفون: مطوري scikit-learn
# معرف الترخيص: BSD-3-Clause

import matplotlib.lines as mlines
import matplotlib.pyplot as plt

from sklearn import svm
from sklearn.datasets import make_blobs
from sklearn.inspection import DecisionBoundaryDisplay

# نقوم بإنشاء مجموعتين من النقاط العشوائية
n_samples_1 = 1000
n_samples_2 = 100
centers = [[0.0, 0.0], [2.0, 2.0]]
clusters_std = [1.5, 0.5]
X, y = make_blobs(
    n_samples=[n_samples_1, n_samples_2],
    centers=centers,
    cluster_std=clusters_std,
    random_state=0,
    shuffle=False,
)

# نقوم بضبط النموذج والحصول على المستوي الفاصل
clf = svm.SVC(kernel="linear", C=1.0)
clf.fit(X, y)

# نقوم بضبط النموذج والحصول على المستوي الفاصل باستخدام الطبقات المرجحة
wclf = svm.SVC(kernel="linear", class_weight={1: 10})
wclf.fit(X, y)

# رسم العينات
plt.scatter(X[:, 0], X[:, 1], c=y, cmap=plt.cm.Paired, edgecolors="k")

# رسم دالات القرار لكل من المصنفين
ax = plt.gca()
disp = DecisionBoundaryDisplay.from_estimator(
    clf,
    X,
    plot_method="contour",
    colors="k",
    levels=[0],
    alpha=0.5,
    linestyles=["-"],
    ax=ax,
)

# رسم حدود القرار والهوامش للطبقات المرجحة
wdisp = DecisionBoundaryDisplay.from_estimator(
    wclf,
    X,
    plot_method="contour",
    colors="r",
    levels=[0],
    alpha=0.5,
    linestyles=["-"],
    ax=ax,
)

plt.legend(
    [
        mlines.Line2D([], [], color="k", label="non weighted"),
        mlines.Line2D([], [], color="r", label="weighted"),
    ],
    ["غير مرجح", "مرجح"],
    loc="upper right",
)
plt.show()
Total running time of the script: (0 minutes 0.160 seconds)
Related examples
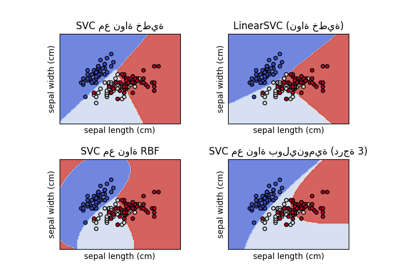
رسم مخططات لمصنفات SVM المختلفة في مجموعة بيانات الزهرة
رسم مخططات لمصنفات SVM المختلفة في مجموعة بيانات الزهرة