ملاحظة
Go to the end to download the full example code. or to run this example in your browser via JupyterLite or Binder
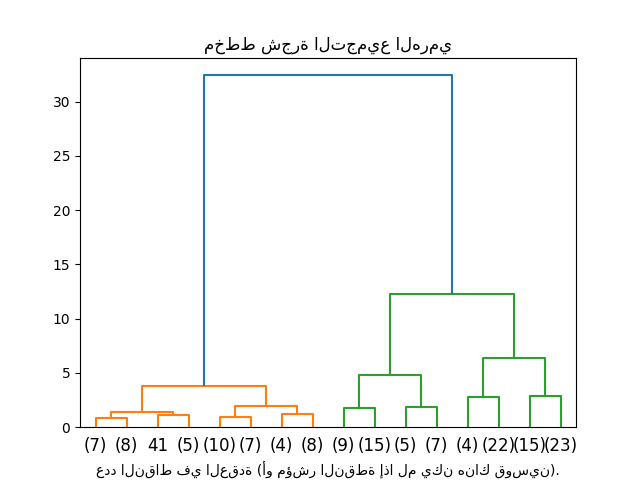
رسم مخطط شجرة التجميع الهرمي#
هذا المثال يرسم مخطط شجرة التجميع المقابل لتجميع هرمي باستخدام AgglomerativeClustering وطريقة dendrogram المتوفرة في scipy.
import numpy as np
from matplotlib import pyplot as plt
from scipy.cluster.hierarchy import dendrogram

from sklearn.cluster import AgglomerativeClustering
from sklearn.datasets import load_iris


def plot_dendrogram(model, **kwargs):
    # إنشاء مصفوفة الربط ثم رسم مخطط شجرة التجميع

    # إنشاء تعداد العينات تحت كل عقدة
    counts = np.zeros(model.children_.shape[0])
    n_samples = len(model.labels_)
    for i, merge in enumerate(model.children_):
        current_count = 0
        for child_idx in merge:
            if child_idx < n_samples:
                current_count += 1  # leaf node
            else:
                current_count += counts[child_idx - n_samples]
        counts[i] = current_count

    linkage_matrix = np.column_stack(
        [model.children_, model.distances_, counts]
    ).astype(float)

    # رسم مخطط شجرة التجميع المقابل
    dendrogram(linkage_matrix, **kwargs)


iris = load_iris()
X = iris.data

# تعيين distance_threshold=0 يضمن حساب الشجرة الكاملة.
model = AgglomerativeClustering(distance_threshold=0, n_clusters=None)

model = model.fit(X)
plt.title("مخطط شجرة التجميع الهرمي")
# رسم المستويات الثلاثة العليا من مخطط شجرة التجميع
plot_dendrogram(model, truncate_mode="level", p=3)
plt.xlabel("عدد النقاط في العقدة (أو مؤشر النقطة إذا لم يكن هناك قوسين).")
plt.show()
Total running time of the script: (0 minutes 0.124 seconds)
Related examples
مقارنة طرق الربط الهرمي المختلفة على مجموعات بيانات تجريبية
مقارنة طرق الربط الهرمي المختلفة على مجموعات بيانات تجريبية