ملاحظة
Go to the end to download the full example code. or to run this example in your browser via JupyterLite or Binder
تقديرات Gradient Boosting Out-of-Bag#
يمكن أن تكون تقديرات Out-of-Bag (OOB) وسيلة مفيدة لتقدير العدد "الأمثل" لدورات التعزيز.
تتشابه تقديرات OOB تقريبًا مع تقديرات التحقق المتقاطع، ولكن يمكن حسابها أثناء التنفيذ دون الحاجة إلى تكرار ملاءمة النموذج.
تتوفر تقديرات OOB فقط لتعزيز التدرج العشوائي
(أي subsample < 1.0)، وتُستمد التقديرات من التحسن في الخسارة بناءً على الأمثلة غير المدرجة في عينة التمهيد
(ما يسمى الأمثلة خارج الكيس).
المقدر OOB هو مقدر متشائم للخسارة الحقيقية للاختبار، ولكنه يبقى تقريبًا جيدًا لعدد صغير من الأشجار.
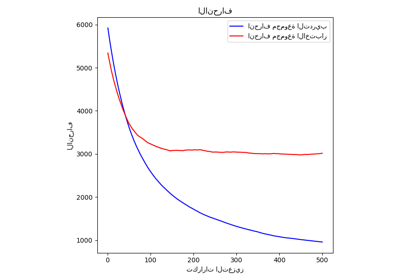
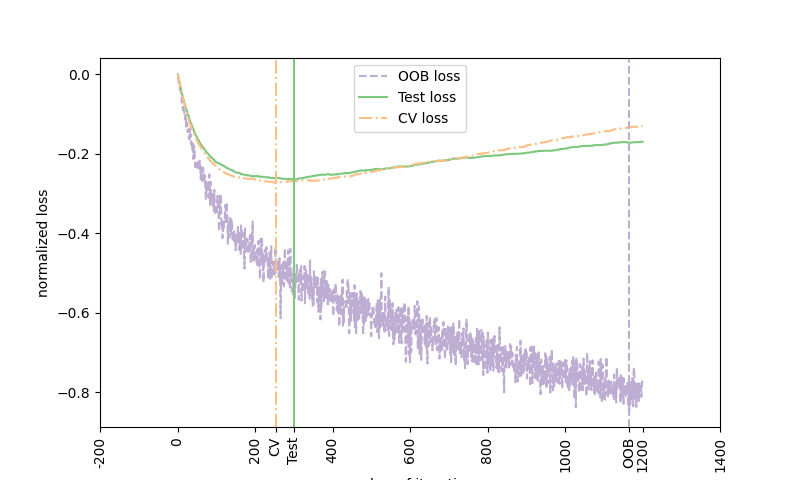
يوضح الشكل المجموع التراكمي للتحسينات السلبية لـ OOB
كدالة لدورة التعزيز. كما ترى، فإنه يتتبع خسارة الاختبار للمائة دورة الأولى ولكن بعد ذلك ينحرف بطريقة متشائمة.
يوضح الشكل أيضًا أداء التحقق المتقاطع 3-fold الذي
يعطي عادة تقديرًا أفضل لخسارة الاختبار
ولكنه أكثر تطلبًا من الناحية الحسابية.
Accuracy: 0.6860
# المؤلفون: مطوري scikit-learn
# معرف الترخيص: BSD-3-Clause

import matplotlib.pyplot as plt
import numpy as np
from scipy.special import expit

from sklearn import ensemble
from sklearn.metrics import log_loss
from sklearn.model_selection import KFold, train_test_split

# Generate data (adapted from G. Ridgeway's gbm example)
n_samples = 1000
random_state = np.random.RandomState(13)
x1 = random_state.uniform(size=n_samples)
x2 = random_state.uniform(size=n_samples)
x3 = random_state.randint(0, 4, size=n_samples)

p = expit(np.sin(3 * x1) - 4 * x2 + x3)
y = random_state.binomial(1, p, size=n_samples)

X = np.c_[x1, x2, x3]

X = X.astype(np.float32)
X_train, X_test, y_train, y_test = train_test_split(X, y, test_size=0.5, random_state=9)

# Fit classifier with out-of-bag estimates
params = {
    "n_estimators": 1200,
    "max_depth": 3,
    "subsample": 0.5,
    "learning_rate": 0.01,
    "min_samples_leaf": 1,
    "random_state": 3,
}
clf = ensemble.GradientBoostingClassifier(**params)

clf.fit(X_train, y_train)
acc = clf.score(X_test, y_test)
print("Accuracy: {:.4f}".format(acc))

n_estimators = params["n_estimators"]
x = np.arange(n_estimators) + 1


def heldout_score(clf, X_test, y_test):
    """compute deviance scores on ``X_test`` and ``y_test``."""
    score = np.zeros((n_estimators,), dtype=np.float64)
    for i, y_proba in enumerate(clf.staged_predict_proba(X_test)):
        score[i] = 2 * log_loss(y_test, y_proba[:, 1])
    return score


def cv_estimate(n_splits=None):
    cv = KFold(n_splits=n_splits)
    cv_clf = ensemble.GradientBoostingClassifier(**params)
    val_scores = np.zeros((n_estimators,), dtype=np.float64)
    for train, test in cv.split(X_train, y_train):
        cv_clf.fit(X_train[train], y_train[train])
        val_scores += heldout_score(cv_clf, X_train[test], y_train[test])
    val_scores /= n_splits
    return val_scores


# Estimate best n_estimator using cross-validation
cv_score = cv_estimate(3)

# Compute best n_estimator for test data
test_score = heldout_score(clf, X_test, y_test)

# negative cumulative sum of oob improvements
cumsum = -np.cumsum(clf.oob_improvement_)

# min loss according to OOB
oob_best_iter = x[np.argmin(cumsum)]

# min loss according to test (normalize such that first loss is 0)
test_score -= test_score[0]
test_best_iter = x[np.argmin(test_score)]

# min loss according to cv (normalize such that first loss is 0)
cv_score -= cv_score[0]
cv_best_iter = x[np.argmin(cv_score)]

# color brew for the three curves
oob_color = list(map(lambda x: x / 256.0, (190, 174, 212)))
test_color = list(map(lambda x: x / 256.0, (127, 201, 127)))
cv_color = list(map(lambda x: x / 256.0, (253, 192, 134)))

# line type for the three curves
oob_line = "dashed"
test_line = "solid"
cv_line = "dashdot"
# line type for the three curves
oob_line = "dashed"
test_line = "solid"
cv_line = "dashdot"

# plot curves and vertical lines for best iterations
plt.figure(figsize=(8, 4.8))
plt.plot(x, cumsum, label="OOB loss", color=oob_color, linestyle=oob_line)
plt.plot(x, test_score, label="Test loss", color=test_color, linestyle=test_line)
plt.plot(x, cv_score, label="CV loss", color=cv_color, linestyle=cv_line)
plt.axvline(x=oob_best_iter, color=oob_color, linestyle=oob_line)
plt.axvline(x=test_best_iter, color=test_color, linestyle=test_line)
plt.axvline(x=cv_best_iter, color=cv_color, linestyle=cv_line)

# add three vertical lines to xticks
xticks = plt.xticks()
xticks_pos = np.array(
    xticks[0].tolist() + [oob_best_iter, cv_best_iter, test_best_iter]
)
xticks_label = np.array(list(map(lambda t: int(t), xticks[0])) + ["OOB", "CV", "Test"])
ind = np.argsort(xticks_pos)
xticks_pos = xticks_pos[ind]
xticks_label = xticks_label[ind]
plt.xticks(xticks_pos, xticks_label, rotation=90)

plt.legend(loc="upper center")
plt.ylabel("normalized loss")
plt.xlabel("number of iterations")

plt.show()
Total running time of the script: (0 minutes 11.122 seconds)
Related examples