عرض خطوط الأنابيب#

تكوين العرض الافتراضي لخط الأنابيب في دفتر Jupyter هو 'diagram' حيث set_config(display='diagram'). لإلغاء تنشيط التمثيل HTML، استخدم set_config(display='text').

لمشاهدة خطوات أكثر تفصيلاً في تصور خط الأنابيب، انقر على الخطوات في خط الأنابيب.

# المؤلفون: مطوري scikit-learn
# معرف SPDX-License: BSD-3-Clause

عرض خط أنابيب مع خطوة ما قبل المعالجة والتصنيف#

يقوم هذا القسم ببناء Pipeline مع خطوة ما قبل المعالجة ، StandardScaler، والتصنيف، LogisticRegression، ويعرض تمثيله المرئي.

from sklearn import set_config
from sklearn.linear_model import LogisticRegression
from sklearn.pipeline import Pipeline
from sklearn.preprocessing import StandardScaler

steps = [
    ("preprocessing", StandardScaler()),
    ("classifier", LogisticRegression()),
]
pipe = Pipeline(steps)

لعرض المخطط، الافتراضي هو display='diagram'.

set_config(display="diagram")
pipe  # انقر على المخطط أدناه لمشاهدة تفاصيل كل خطوة
Pipeline(steps=[('preprocessing', StandardScaler()),
                ('classifier', LogisticRegression())])
In a Jupyter environment, please rerun this cell to show the HTML representation or trust the notebook.
On GitHub, the HTML representation is unable to render, please try loading this page with nbviewer.org.


لمشاهدة خط الأنابيب النصي، قم بتغييره إلى display='text'.

set_config(display="text")
pipe
Pipeline(steps=[('preprocessing', StandardScaler()),
                ('classifier', LogisticRegression())])

إعادة إعداد العرض الافتراضي

set_config(display="diagram")

عرض خط أنابيب يربط بين خطوات ما قبل المعالجة والتصنيف#

يقوم هذا القسم ببناء Pipeline مع خطوات متعددة ما قبل المعالجة، PolynomialFeatures و StandardScaler، وخطوة التصنيف، LogisticRegression، ويعرض تمثيله المرئي.

from sklearn.linear_model import LogisticRegression
from sklearn.pipeline import Pipeline
from sklearn.preprocessing import PolynomialFeatures, StandardScaler

steps = [
    ("standard_scaler", StandardScaler()),
    ("polynomial", PolynomialFeatures(degree=3)),
    ("classifier", LogisticRegression(C=2.0)),
]
pipe = Pipeline(steps)
pipe  # انقر على المخطط أدناه لمشاهدة تفاصيل كل خطوة
Pipeline(steps=[('standard_scaler', StandardScaler()),
                ('polynomial', PolynomialFeatures(degree=3)),
                ('classifier', LogisticRegression(C=2.0))])
In a Jupyter environment, please rerun this cell to show the HTML representation or trust the notebook.
On GitHub, the HTML representation is unable to render, please try loading this page with nbviewer.org.


عرض خط أنابيب وخفض الأبعاد والتصنيف#

يقوم هذا القسم ببناء Pipeline مع خطوة خفض الأبعاد، PCA، ، SVC، ويعرض تمثيله المرئي.

from sklearn.decomposition import PCA
from sklearn.pipeline import Pipeline
from sklearn.svm import SVC

steps = [("reduce_dim", PCA(n_components=4)), ("classifier", SVC(kernel="linear"))]
pipe = Pipeline(steps)
pipe  # انقر على المخطط أدناه لمشاهدة تفاصيل كل خطوة
Pipeline(steps=[('reduce_dim', PCA(n_components=4)),
                ('classifier', SVC(kernel='linear'))])
In a Jupyter environment, please rerun this cell to show the HTML representation or trust the notebook.
On GitHub, the HTML representation is unable to render, please try loading this page with nbviewer.org.


عرض خط أنابيب معقد يربط بين محول الأعمدة#

يقوم هذا القسم ببناء خط أنابيب معقد Pipeline مع ColumnTransformer والتصنيف، LogisticRegression، ويعرض تمثيله المرئي.

import numpy as np

from sklearn.compose import ColumnTransformer
from sklearn.impute import SimpleImputer
from sklearn.linear_model import LogisticRegression
from sklearn.pipeline import Pipeline, make_pipeline
from sklearn.preprocessing import OneHotEncoder, StandardScaler

numeric_preprocessor = Pipeline(
    steps=[
        ("imputation_mean", SimpleImputer(missing_values=np.nan, strategy="mean")),
        ("scaler", StandardScaler()),
    ]
)

categorical_preprocessor = Pipeline(
    steps=[
        (
            "imputation_constant",
            SimpleImputer(fill_value="missing", strategy="constant"),
        ),
        ("onehot", OneHotEncoder(handle_unknown="ignore")),
    ]
)

preprocessor = ColumnTransformer(
    [
        ("categorical", categorical_preprocessor, ["state", "gender"]),
        ("numerical", numeric_preprocessor, ["age", "weight"]),
    ]
)

pipe = make_pipeline(preprocessor, LogisticRegression(max_iter=500))
pipe  # انقر على المخطط أدناه لمشاهدة تفاصيل كل خطوة
Pipeline(steps=[('columntransformer',
                 ColumnTransformer(transformers=[('categorical',
                                                  Pipeline(steps=[('imputation_constant',
                                                                   SimpleImputer(fill_value='missing',
                                                                                 strategy='constant')),
                                                                  ('onehot',
                                                                   OneHotEncoder(handle_unknown='ignore'))]),
                                                  ['state', 'gender']),
                                                 ('numerical',
                                                  Pipeline(steps=[('imputation_mean',
                                                                   SimpleImputer()),
                                                                  ('scaler',
                                                                   StandardScaler())]),
                                                  ['age', 'weight'])])),
                ('logisticregression', LogisticRegression(max_iter=500))])
In a Jupyter environment, please rerun this cell to show the HTML representation or trust the notebook.
On GitHub, the HTML representation is unable to render, please try loading this page with nbviewer.org.


عرض بحث شبكي عبر خط أنابيب مع تصنيف#

يقوم هذا القسم ببناء GridSearchCV عبر Pipeline مع RandomForestClassifier ويعرض تمثيله المرئي.

import numpy as np

from sklearn.compose import ColumnTransformer
from sklearn.ensemble import RandomForestClassifier
from sklearn.impute import SimpleImputer
from sklearn.model_selection import GridSearchCV
from sklearn.pipeline import Pipeline, make_pipeline
from sklearn.preprocessing import OneHotEncoder, StandardScaler

numeric_preprocessor = Pipeline(
    steps=[
        ("imputation_mean", SimpleImputer(missing_values=np.nan, strategy="mean")),
        ("scaler", StandardScaler()),
    ]
)

categorical_preprocessor = Pipeline(
    steps=[
        (
            "imputation_constant",
            SimpleImputer(fill_value="missing", strategy="constant"),
        ),
        ("onehot", OneHotEncoder(handle_unknown="ignore")),
    ]
)

preprocessor = ColumnTransformer(
    [
        ("categorical", categorical_preprocessor, ["state", "gender"]),
        ("numerical", numeric_preprocessor, ["age", "weight"]),
    ]
)

pipe = Pipeline(
    steps=[("preprocessor", preprocessor), ("classifier", RandomForestClassifier())]
)

param_grid = {
    "classifier__n_estimators": [200, 500],
    "classifier__max_features": ["auto", "sqrt", "log2"],
    "classifier__max_depth": [4, 5, 6, 7, 8],
    "classifier__criterion": ["gini", "entropy"],
}

grid_search = GridSearchCV(pipe, param_grid=param_grid, n_jobs=1)
grid_search  # انقر على المخطط أدناه لمشاهدة تفاصيل كل خطوة
GridSearchCV(estimator=Pipeline(steps=[('preprocessor',
                                        ColumnTransformer(transformers=[('categorical',
                                                                         Pipeline(steps=[('imputation_constant',
                                                                                          SimpleImputer(fill_value='missing',
                                                                                                        strategy='constant')),
                                                                                         ('onehot',
                                                                                          OneHotEncoder(handle_unknown='ignore'))]),
                                                                         ['state',
                                                                          'gender']),
                                                                        ('numerical',
                                                                         Pipeline(steps=[('imputation_mean',
                                                                                          SimpleImputer()),
                                                                                         ('scaler',
                                                                                          StandardScaler())]),
                                                                         ['age',
                                                                          'weight'])])),
                                       ('classifier',
                                        RandomForestClassifier())]),
             n_jobs=1,
             param_grid={'classifier__criterion': ['gini', 'entropy'],
                         'classifier__max_depth': [4, 5, 6, 7, 8],
                         'classifier__max_features': ['auto', 'sqrt', 'log2'],
                         'classifier__n_estimators': [200, 500]})
In a Jupyter environment, please rerun this cell to show the HTML representation or trust the notebook.
On GitHub, the HTML representation is unable to render, please try loading this page with nbviewer.org.


Total running time of the script: (0 minutes 0.156 seconds)

Related examples
محول الأعمدة مع الأنواع المختلطة

محول الأعمدة مع الأنواع المختلطة

عرض المنمذجات وأنابيب التوصيل المعقدة

عرض المنمذجات وأنابيب التوصيل المعقدة

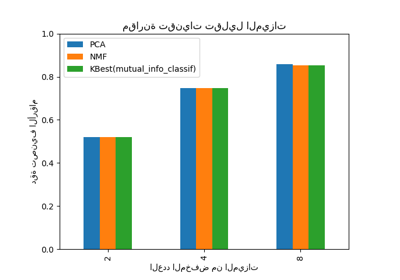
اختيار تقليل الأبعاد باستخدام Pipeline و GridSearchCV

اختيار تقليل الأبعاد باستخدام Pipeline و GridSearchCV

محول الأعمدة مع مصادر بيانات غير متجانسة

محول الأعمدة مع مصادر بيانات غير متجانسة

Gallery generated by Sphinx-Gallery