ملاحظة
Go to the end to download the full example code. or to run this example in your browser via JupyterLite or Binder
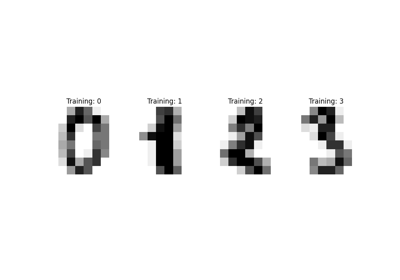
ميزات شبكة بولتزمان المقيدة لتصنيف الأرقام#
بالنسبة لبيانات الصور الرمادية، حيث يمكن تفسير قيم البكسل على أنها درجات من السواد على خلفية بيضاء، مثل التعرف على الأرقام المكتوبة بخط اليد، يمكن لنموذج شبكة بولتزمان المقيدة ذات التوزيع البرنولي (BernoulliRBM) أن يقوم باستخراج الميزات غير الخطية بشكل فعال.
# المؤلفون: مطوري مكتبة سكايلرن
# معرف الترخيص: BSD-3-Clause
توليد البيانات#
من أجل تعلم تمثيلات كامنة جيدة من مجموعة بيانات صغيرة، نقوم بتوليد المزيد من البيانات المُعَلَّمة بشكل اصطناعي عن طريق إزعاج بيانات التدريب مع تحولات خطية بمقدار 1 بكسل في كل اتجاه.
import numpy as np
from scipy.ndimage import convolve

from sklearn import datasets
from sklearn.model_selection import train_test_split
from sklearn.preprocessing import minmax_scale


def nudge_dataset(X, Y):
    """
    هذا ينتج مجموعة بيانات أكبر بخمس مرات من الأصلية،
    عن طريق تحريك الصور 8x8 في X حولها بمقدار 1px إلى اليسار، اليمين، الأسفل، الأعلى
    """
    direction_vectors = [
        [[0, 1, 0], [0, 0, 0], [0, 0, 0]],
        [[0, 0, 0], [1, 0, 0], [0, 0, 0]],
        [[0, 0, 0], [0, 0, 1], [0, 0, 0]],
        [[0, 0, 0], [0, 0, 0], [0, 1, 0]],
    ]

    def shift(x, w):
        return convolve(x.reshape((8, 8)), mode="constant", weights=w).ravel()

    X = np.concatenate(
        [X] + [np.apply_along_axis(shift, 1, X, vector) for vector in direction_vectors]
    )
    Y = np.concatenate([Y for _ in range(5)], axis=0)
    return X, Y


X, y = datasets.load_digits(return_X_y=True)
X = np.asarray(X, "float32")
X, Y = nudge_dataset(X, y)
X = minmax_scale(X, feature_range=(0, 1))  # 0-1 scaling

X_train, X_test, Y_train, Y_test = train_test_split(X, Y, test_size=0.2, random_state=0)
تعريف النماذج#
نقوم ببناء خط أنابيب التصنيف مع مستخرج ميزات BernoulliRBM و
مصنف LogisticRegression
from sklearn import linear_model
from sklearn.neural_network import BernoulliRBM
from sklearn.pipeline import Pipeline

logistic = linear_model.LogisticRegression(solver="newton-cg", tol=1)
rbm = BernoulliRBM(random_state=0, verbose=True)

rbm_features_classifier = Pipeline(steps=[("rbm", rbm), ("logistic", logistic)])
التدريب#
تم تحسين فرط معاملات النموذج بالكامل (معدل التعلم، حجم الطبقة المخفية، التنظيم) عن طريق البحث الشبكي، ولكن البحث غير مستنسخ هنا بسبب قيود وقت التشغيل.
from sklearn.base import clone

# فرط المعاملات. تم ضبط هذه القيم عن طريق التحقق من الصحة المتقاطعة،
# باستخدام GridSearchCV. هنا لا نقوم بالتحقق من الصحة المتقاطعة لتوفير الوقت.
rbm.learning_rate = 0.06
rbm.n_iter = 10

# المزيد من المكونات تميل إلى إعطاء أداء تنبؤ أفضل، ولكن وقت
# ملاءمة أكبر
rbm.n_components = 100
logistic.C = 6000

# تدريب خط أنابيب RBM-Logistic
rbm_features_classifier.fit(X_train, Y_train)

# تدريب مصنف الانحدار اللوجستي مباشرة على البكسل
raw_pixel_classifier = clone(logistic)
raw_pixel_classifier.C = 100.0
raw_pixel_classifier.fit(X_train, Y_train)
[BernoulliRBM] Iteration 1, pseudo-likelihood = -25.57, time = 0.13s
[BernoulliRBM] Iteration 2, pseudo-likelihood = -23.68, time = 0.26s
[BernoulliRBM] Iteration 3, pseudo-likelihood = -22.88, time = 0.18s
[BernoulliRBM] Iteration 4, pseudo-likelihood = -21.91, time = 0.20s
[BernoulliRBM] Iteration 5, pseudo-likelihood = -21.79, time = 0.17s
[BernoulliRBM] Iteration 6, pseudo-likelihood = -20.96, time = 0.16s
[BernoulliRBM] Iteration 7, pseudo-likelihood = -20.80, time = 0.19s
[BernoulliRBM] Iteration 8, pseudo-likelihood = -20.63, time = 0.16s
[BernoulliRBM] Iteration 9, pseudo-likelihood = -20.38, time = 0.20s
[BernoulliRBM] Iteration 10, pseudo-likelihood = -20.19, time = 0.16s
التقييم#
from sklearn import metrics

Y_pred = rbm_features_classifier.predict(X_test)
print(
    "انحدار لوجستي باستخدام ميزات RBM:\n%s\n"
    % (metrics.classification_report(Y_test, Y_pred))
)
/project/workspace/sklearn/metrics/_classification.py:1613: UndefinedMetricWarning:

Precision is ill-defined and being set to 0.0 in labels with no predicted samples. Use `zero_division` parameter to control this behavior.

/project/workspace/sklearn/metrics/_classification.py:1613: UndefinedMetricWarning:

Precision is ill-defined and being set to 0.0 in labels with no predicted samples. Use `zero_division` parameter to control this behavior.

/project/workspace/sklearn/metrics/_classification.py:1613: UndefinedMetricWarning:

Precision is ill-defined and being set to 0.0 in labels with no predicted samples. Use `zero_division` parameter to control this behavior.

انحدار لوجستي باستخدام ميزات RBM:
              precision    recall  f1-score   support

           0       0.10      1.00      0.18       174
           1       0.00      0.00      0.00       184
           2       0.00      0.00      0.00       166
           3       0.00      0.00      0.00       194
           4       0.00      0.00      0.00       186
           5       0.00      0.00      0.00       181
           6       0.00      0.00      0.00       207
           7       0.00      0.00      0.00       154
           8       0.00      0.00      0.00       182
           9       0.00      0.00      0.00       169

    accuracy                           0.10      1797
   macro avg       0.01      0.10      0.02      1797
weighted avg       0.01      0.10      0.02      1797
Y_pred = raw_pixel_classifier.predict(X_test)
print(
    "انحدار لوجستي باستخدام ميزات البكسل الخام:\n%s\n"
    % (metrics.classification_report(Y_test, Y_pred))
)
/project/workspace/sklearn/metrics/_classification.py:1613: UndefinedMetricWarning:

Precision is ill-defined and being set to 0.0 in labels with no predicted samples. Use `zero_division` parameter to control this behavior.

/project/workspace/sklearn/metrics/_classification.py:1613: UndefinedMetricWarning:

Precision is ill-defined and being set to 0.0 in labels with no predicted samples. Use `zero_division` parameter to control this behavior.

/project/workspace/sklearn/metrics/_classification.py:1613: UndefinedMetricWarning:

Precision is ill-defined and being set to 0.0 in labels with no predicted samples. Use `zero_division` parameter to control this behavior.

انحدار لوجستي باستخدام ميزات البكسل الخام:
              precision    recall  f1-score   support

           0       0.10      1.00      0.18       174
           1       0.00      0.00      0.00       184
           2       0.00      0.00      0.00       166
           3       0.00      0.00      0.00       194
           4       0.00      0.00      0.00       186
           5       0.00      0.00      0.00       181
           6       0.00      0.00      0.00       207
           7       0.00      0.00      0.00       154
           8       0.00      0.00      0.00       182
           9       0.00      0.00      0.00       169

    accuracy                           0.10      1797
   macro avg       0.01      0.10      0.02      1797
weighted avg       0.01      0.10      0.02      1797
تساعد الميزات المستخرجة بواسطة BernoulliRBM في تحسين دقة التصنيف فيما يتعلق بالانحدار اللوجستي على البكسل الخام.
الرسم#
import matplotlib.pyplot as plt
plt.figure(figsize=(4.2, 4))
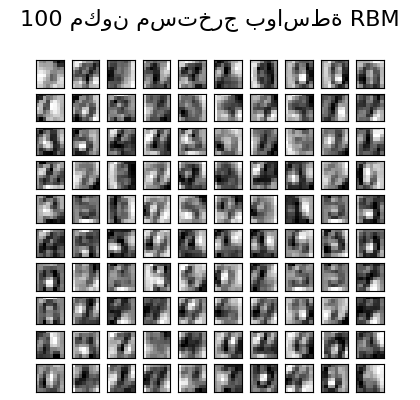
for i, comp in enumerate(rbm.components_):
plt.subplot(10, 10, i + 1)
plt.imshow(comp.reshape((8, 8)), cmap=plt.cm.gray_r, interpolation="nearest")
plt.xticks(())
plt.yticks(())
plt.suptitle("100 مكون مستخرج بواسطة RBM", fontsize=16)
plt.subplots_adjust(0.08, 0.02, 0.92, 0.85, 0.08, 0.23)
plt.show()
Total running time of the script: (0 minutes 4.100 seconds)
Related examples