ملاحظة
Go to the end to download the full example code. or to run this example in your browser via JupyterLite or Binder
نشر العلامات على الأرقام: توضيح الأداء#
يوضح هذا المثال قوة التعلم شبه المُشرف من خلال تدريب نموذج نشر العلامات لتصنيف الأرقام المكتوبة بخط اليد باستخدام مجموعات ذات عدد قليل جدًا من العلامات.
يحتوي مجموعة البيانات للأرقام المكتوبة بخط اليد على 1797 نقطة إجمالية. سيتم تدريب النموذج باستخدام جميع النقاط، ولكن سيتم وضع علامات على 30 نقطة فقط. ستكون النتائج على شكل مصفوفة ارتباك وسلسلة من المقاييس عبر كل فئة ستكون جيدة جدًا.
في النهاية، سيتم عرض أفضل 10 تنبؤات غير مؤكدة.
# المؤلفون: مطوري سكايلرن
# معرف الترخيص: BSD-3-Clause
توليد البيانات#
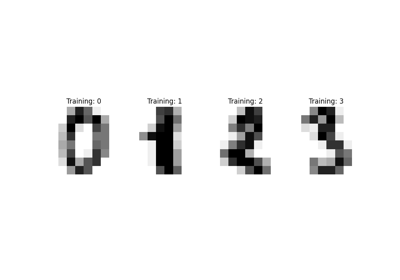
نستخدم مجموعة بيانات الأرقام. نستخدم فقط مجموعة فرعية من العينات المحددة عشوائيًا.
import numpy as np

from sklearn import datasets

digits = datasets.load_digits()
rng = np.random.RandomState(2)
indices = np.arange(len(digits.data))
rng.shuffle(indices)
قمنا باختيار 340 عينة، منها 40 فقط سترتبط بعلامة معروفة. لذلك، نقوم بتخزين مؤشرات 300 عينة أخرى والتي من المفترض ألا نعرف علاماتها.
X = digits.data[indices[:340]]
y = digits.target[indices[:340]]
images = digits.images[indices[:340]]

n_total_samples = len(y)
n_labeled_points = 40

indices = np.arange(n_total_samples)

unlabeled_set = indices[n_labeled_points:]
خلط كل شيء
y_train = np.copy(y)
y_train[unlabeled_set] = -1
التعلم شبه المُشرف#
نقوم بضبط LabelSpreading واستخدامه للتنبؤ
بالعلامات غير المعروفة.
from sklearn.metrics import classification_report
from sklearn.semi_supervised import LabelSpreading

lp_model = LabelSpreading(gamma=0.25, max_iter=20)
lp_model.fit(X, y_train)
predicted_labels = lp_model.transduction_[unlabeled_set]
true_labels = y[unlabeled_set]

print(
"نموذج نشر العلامات: %d مع علامات و %d بدون علامات (%d إجمالي)"
% (n_labeled_points, n_total_samples - n_labeled_points, n_total_samples)
)
نموذج نشر العلامات: 40 مع علامات و 300 بدون علامات (340 إجمالي)
تقرير التصنيف
print(classification_report(true_labels, predicted_labels))
              precision    recall  f1-score   support

           0       1.00      1.00      1.00        27
           1       0.82      1.00      0.90        37
           2       1.00      0.86      0.92        28
           3       1.00      0.80      0.89        35
           4       0.92      1.00      0.96        24
           5       0.74      0.94      0.83        34
           6       0.89      0.96      0.92        25
           7       0.94      0.89      0.91        35
           8       1.00      0.68      0.81        31
           9       0.81      0.88      0.84        24

    accuracy                           0.90       300
   macro avg       0.91      0.90      0.90       300
weighted avg       0.91      0.90      0.90       300
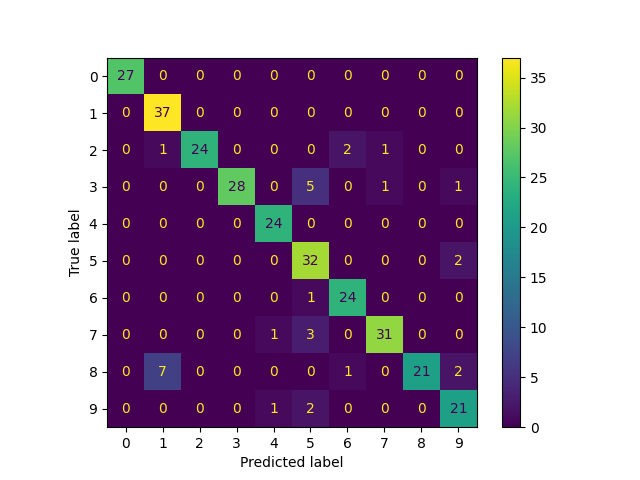
مصفوفة الارتباك
from sklearn.metrics import ConfusionMatrixDisplay

ConfusionMatrixDisplay.from_predictions(
    true_labels, predicted_labels, labels=lp_model.classes_
)
<sklearn.metrics._plot.confusion_matrix.ConfusionMatrixDisplay object at 0x7fe49f903a90>
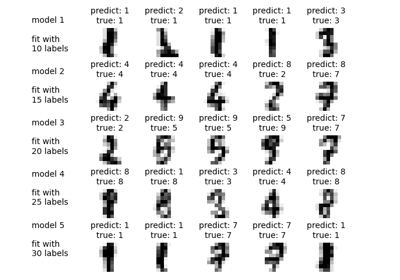
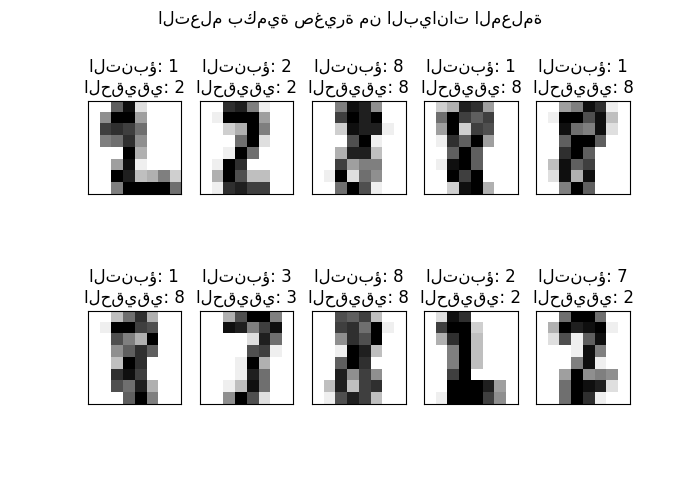
رسم التنبؤات الأكثر غموضًا#
هنا، سنختار ونعرض أفضل 10 تنبؤات غير مؤكدة.
from scipy import stats

pred_entropies = stats.distributions.entropy(lp_model.label_distributions_.T)
اختيار أفضل 10 علامات غير مؤكدة
uncertainty_index = np.argsort(pred_entropies)[-10:]
رسم
import matplotlib.pyplot as plt

f = plt.figure(figsize=(7, 5))
for index, image_index in enumerate(uncertainty_index):
    image = images[image_index]

    sub = f.add_subplot(2, 5, index + 1)
    sub.imshow(image, cmap=plt.cm.gray_r)
    plt.xticks([])
    plt.yticks([])
    sub.set_title(
        "التنبؤ: %i\nالحقيقي: %i" % (lp_model.transduction_[image_index], y[image_index])
    )

f.suptitle("التعلم بكمية صغيرة من البيانات المعلمة")
plt.show()
Total running time of the script: (0 minutes 0.455 seconds)
Related examples