ملاحظة
Go to the end to download the full example code. or to run this example in your browser via JupyterLite or Binder
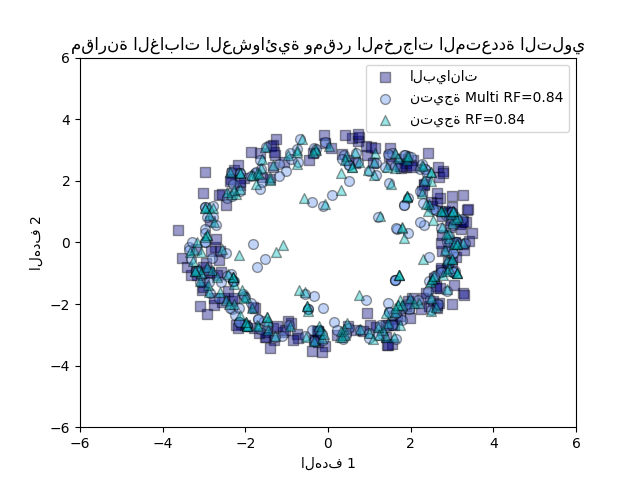
مقارنة الغابات العشوائية ومقدر المخرجات المتعددة التلوي#
مثال لمقارنة انحدار المخرجات المتعددة مع الغابة العشوائية والمقدر التلوي multioutput.MultiOutputRegressor.
يوضح هذا المثال استخدام المقدر التلوي multioutput.MultiOutputRegressor لإجراء انحدار متعدد المخرجات. يتم استخدام مُنحدِر غابة عشوائية، والذي يدعم انحدار المخرجات المتعددة أصلاً، بحيث يمكن مقارنة النتائج.
لن يتنبأ مُنحدِر الغابة العشوائية إلا بالقيم ضمن نطاق الملاحظات أو الأقرب إلى الصفر لكل هدف. نتيجة لذلك، يكون التنبؤ متحيزًا نحو مركز الدائرة.
باستخدام ميزة أساسية واحدة، يتعلم النموذج كلاً من إحداثيات x و y كمخرجات.
# Authors: The scikit-learn developers
# SPDX-License-Identifier: BSD-3-Clause

import matplotlib.pyplot as plt
import numpy as np

from sklearn.ensemble import RandomForestRegressor
from sklearn.model_selection import train_test_split
from sklearn.multioutput import MultiOutputRegressor

# إنشاء مجموعة بيانات عشوائية
rng = np.random.RandomState(1)
X = np.sort(200 * rng.rand(600, 1) - 100, axis=0)
y = np.array([np.pi * np.sin(X).ravel(), np.pi * np.cos(X).ravel()]).T
y += 0.5 - rng.rand(*y.shape)

X_train, X_test, y_train, y_test = train_test_split(
    X, y, train_size=400, test_size=200, random_state=4
)

max_depth = 30
regr_multirf = MultiOutputRegressor(
    RandomForestRegressor(n_estimators=100, max_depth=max_depth, random_state=0)
)
regr_multirf.fit(X_train, y_train)

regr_rf = RandomForestRegressor(n_estimators=100, max_depth=max_depth, random_state=2)
regr_rf.fit(X_train, y_train)

# التنبؤ ببيانات جديدة
y_multirf = regr_multirf.predict(X_test)
y_rf = regr_rf.predict(X_test)

# رسم النتائج
plt.figure()
s = 50
a = 0.4
plt.scatter(
    y_test[:, 0],
    y_test[:, 1],
    edgecolor="k",
    c="navy",
    s=s,
    marker="s",
    alpha=a,
    label="البيانات",
)
plt.scatter(
    y_multirf[:, 0],
    y_multirf[:, 1],
    edgecolor="k",
    c="cornflowerblue",
    s=s,
    alpha=a,
    label="نتيجة Multi RF=%.2f" % regr_multirf.score(X_test, y_test),
)
plt.scatter(
    y_rf[:, 0],
    y_rf[:, 1],
    edgecolor="k",
    c="c",
    s=s,
    marker="^",
    alpha=a,
    label="نتيجة RF=%.2f" % regr_rf.score(X_test, y_test),
)
plt.xlim([-6, 6])
plt.ylim([-6, 6])
plt.xlabel("الهدف 1")
plt.ylabel("الهدف 2")
plt.title("مقارنة الغابات العشوائية ومقدر المخرجات المتعددة التلوي")
plt.legend()
plt.show()
Total running time of the script: (0 minutes 0.595 seconds)
Related examples