ملاحظة
Go to the end to download the full example code. or to run this example in your browser via JupyterLite or Binder
الانحدار الأيزوتوني#
توضيح للانحدار الأيزوتوني على بيانات مُولدة (اتجاه أحادي غير خطي مع ضوضاء متجانسة التباين).
خوارزمية الانحدار الأيزوتوني تجد تقريبًا غير متناقص لدالة مع تقليل متوسط مربع الخطأ على بيانات التدريب. ميزة هذا النموذج غير البارامتري هي أنه لا يفترض أي شكل للدالة المستهدفة بخلاف الأحادية. وللمقارنة، يتم تقديم الانحدار الخطي أيضًا.
يوضح الرسم البياني على الجانب الأيمن دالة التنبؤ بالنموذج التي تنتج عن الاستيفاء الخطي لنقاط العتبة. ونقاط العتبة هي مجموعة فرعية من ملاحظات مدخلات التدريب، ويتم حساب قيمها المستهدفة المطابقة بواسطة التلاؤم الأيزوتوني غير البارامتري.
# المؤلفون: مطوري سكايلرن
# معرف الترخيص: BSD-3-Clause

import matplotlib.pyplot as plt
import numpy as np
from matplotlib.collections import LineCollection

from sklearn.isotonic import IsotonicRegression
from sklearn.linear_model import LinearRegression
from sklearn.utils import check_random_state

n = 100
x = np.arange(n)
rs = check_random_state(0)
y = rs.randint(-50, 50, size=(n,)) + 50.0 * np.log1p(np.arange(n))
تناسب نماذج IsotonicRegression وLinearRegression:
ir = IsotonicRegression(out_of_bounds="clip")
y_ = ir.fit_transform(x, y)

lr = LinearRegression()
lr.fit(x[:, np.newaxis], y)  # x يجب أن تكون ثنائية الأبعاد للانحدار الخطي
رسم النتائج:
segments = [[[i, y[i]], [i, y_[i]]] for i in range(n)]
lc = LineCollection(segments, zorder=0)
lc.set_array(np.ones(len(y)))
lc.set_linewidths(np.full(n, 0.5))

fig, (ax0, ax1) = plt.subplots(ncols=2, figsize=(12, 6))

ax0.plot(x, y, "C0.", markersize=12)
ax0.plot(x, y_, "C1.-", markersize=12)
ax0.plot(x, lr.predict(x[:, np.newaxis]), "C2-")
ax0.add_collection(lc)
ax0.legend(("Training data", "Isotonic fit", "Linear fit"), loc="lower right")
ax0.set_title("Isotonic regression fit on noisy data (n=%d)" % n)

x_test = np.linspace(-10, 110, 1000)
ax1.plot(x_test, ir.predict(x_test), "C1-")
ax1.plot(ir.X_thresholds_, ir.y_thresholds_, "C1.", markersize=12)
ax1.set_title("Prediction function (%d thresholds)" % len(ir.X_thresholds_))

plt.show()
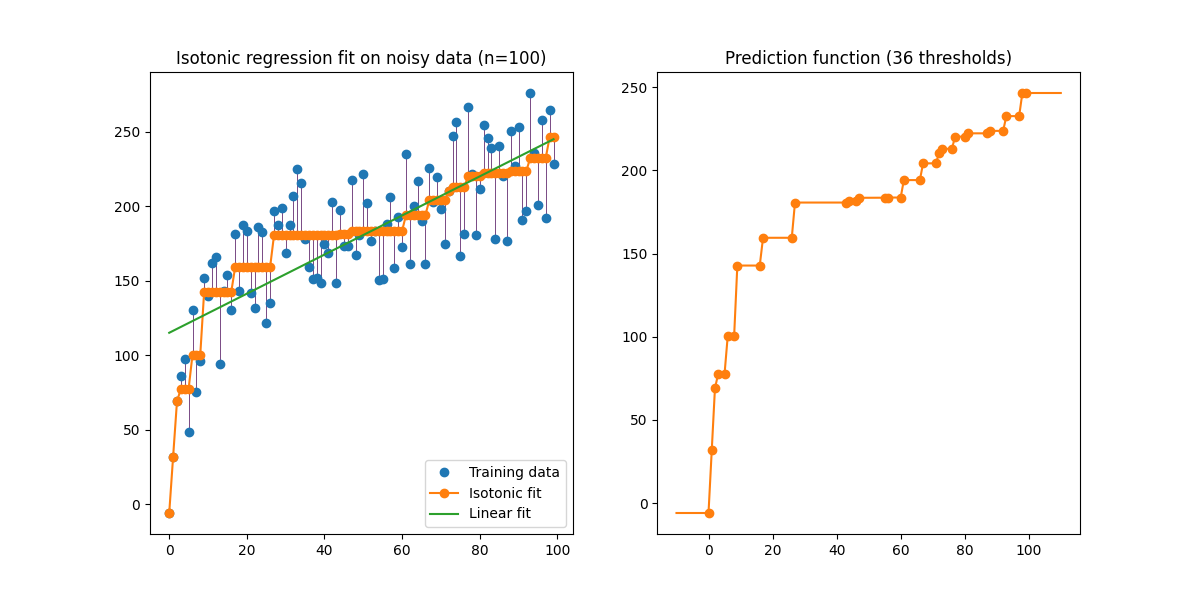
لاحظ أننا مررنا صراحةً out_of_bounds="clip" إلى منشئ IsotonicRegression للتحكم في طريقة استقراء النموذج خارج نطاق البيانات الملاحظة في مجموعة التدريب. يمكن رؤية هذا الاستقراء "القص" على رسم دالة القرار على الجانب الأيمن.
Total running time of the script: (0 minutes 0.149 seconds)
Related examples